Multifamily Technology Map
In your face, CB Insights
If you’ve been around PropTech for a little while, you’ve probably noticed there are several publications that post “market maps” as a way to demonstrate the size of an industry.
This is the (old) one from CBInsights:
You can see there are about 130 companies in this graphic . . . and all sorts of problems.
First, how am I supposed to use this?
I can’t build a comprehensive tech stack. I can’t compare functions, markets, integrations, and pricing. Are they all still solvent? How much money have they raised?
It’s pretty useless as a comparison tool.
Maybe it’s just an education tool to say “Look, lots of companies in the same space!”
To which I say - “So what?”
Again, I just don’t know what I’m supposed to do with this.
It’s nice eye candy but I’ve never been able to use it for anything, you know, helpful.
Plus, 130 companies is laughably small. I track about 4,000 PropTech companies globally.
The graphic above covers about 3% of the PropTech world that I cover.
So, I set out to make my own.
I think we have solved both problems (size and usability) but the size one was easier to start with.
To make this a more manageable graphic, where I’m not cramming 4,000 logos into one image, I broke out PropTech by Property Type. I made databases for Multifamily, Office, Retail, Industrial, Hotel, Development, and Construction.
Multifamily was the biggest so we’ll start there.
Then the question became - “How can I lay these out in a way that is useful to MF owners and managers?”
Having a big database where inspection apps are compared to credit check technology and those are compared to furnishing/design platforms is pretty useless.
So, I broke out all of Multifamily Technology into what I call the Tenant Flow. That is, how does a tenant “flow” through your building? How do they find your website, explore it, tour, sign a lease, move in, etc.
It looks like this:
These categories aren’t perfect, but they are close enough to start. Each category has a set of subcategories.
For example, The Occupy category (what tech we can use while the tenant is actually occupying the unit) will have subcategories like Pet Services, Guest Access, Tenant Engagement, Package Delivery, etc.
All of those are categories where we can use technology to enhance the tenant experience in our properties.
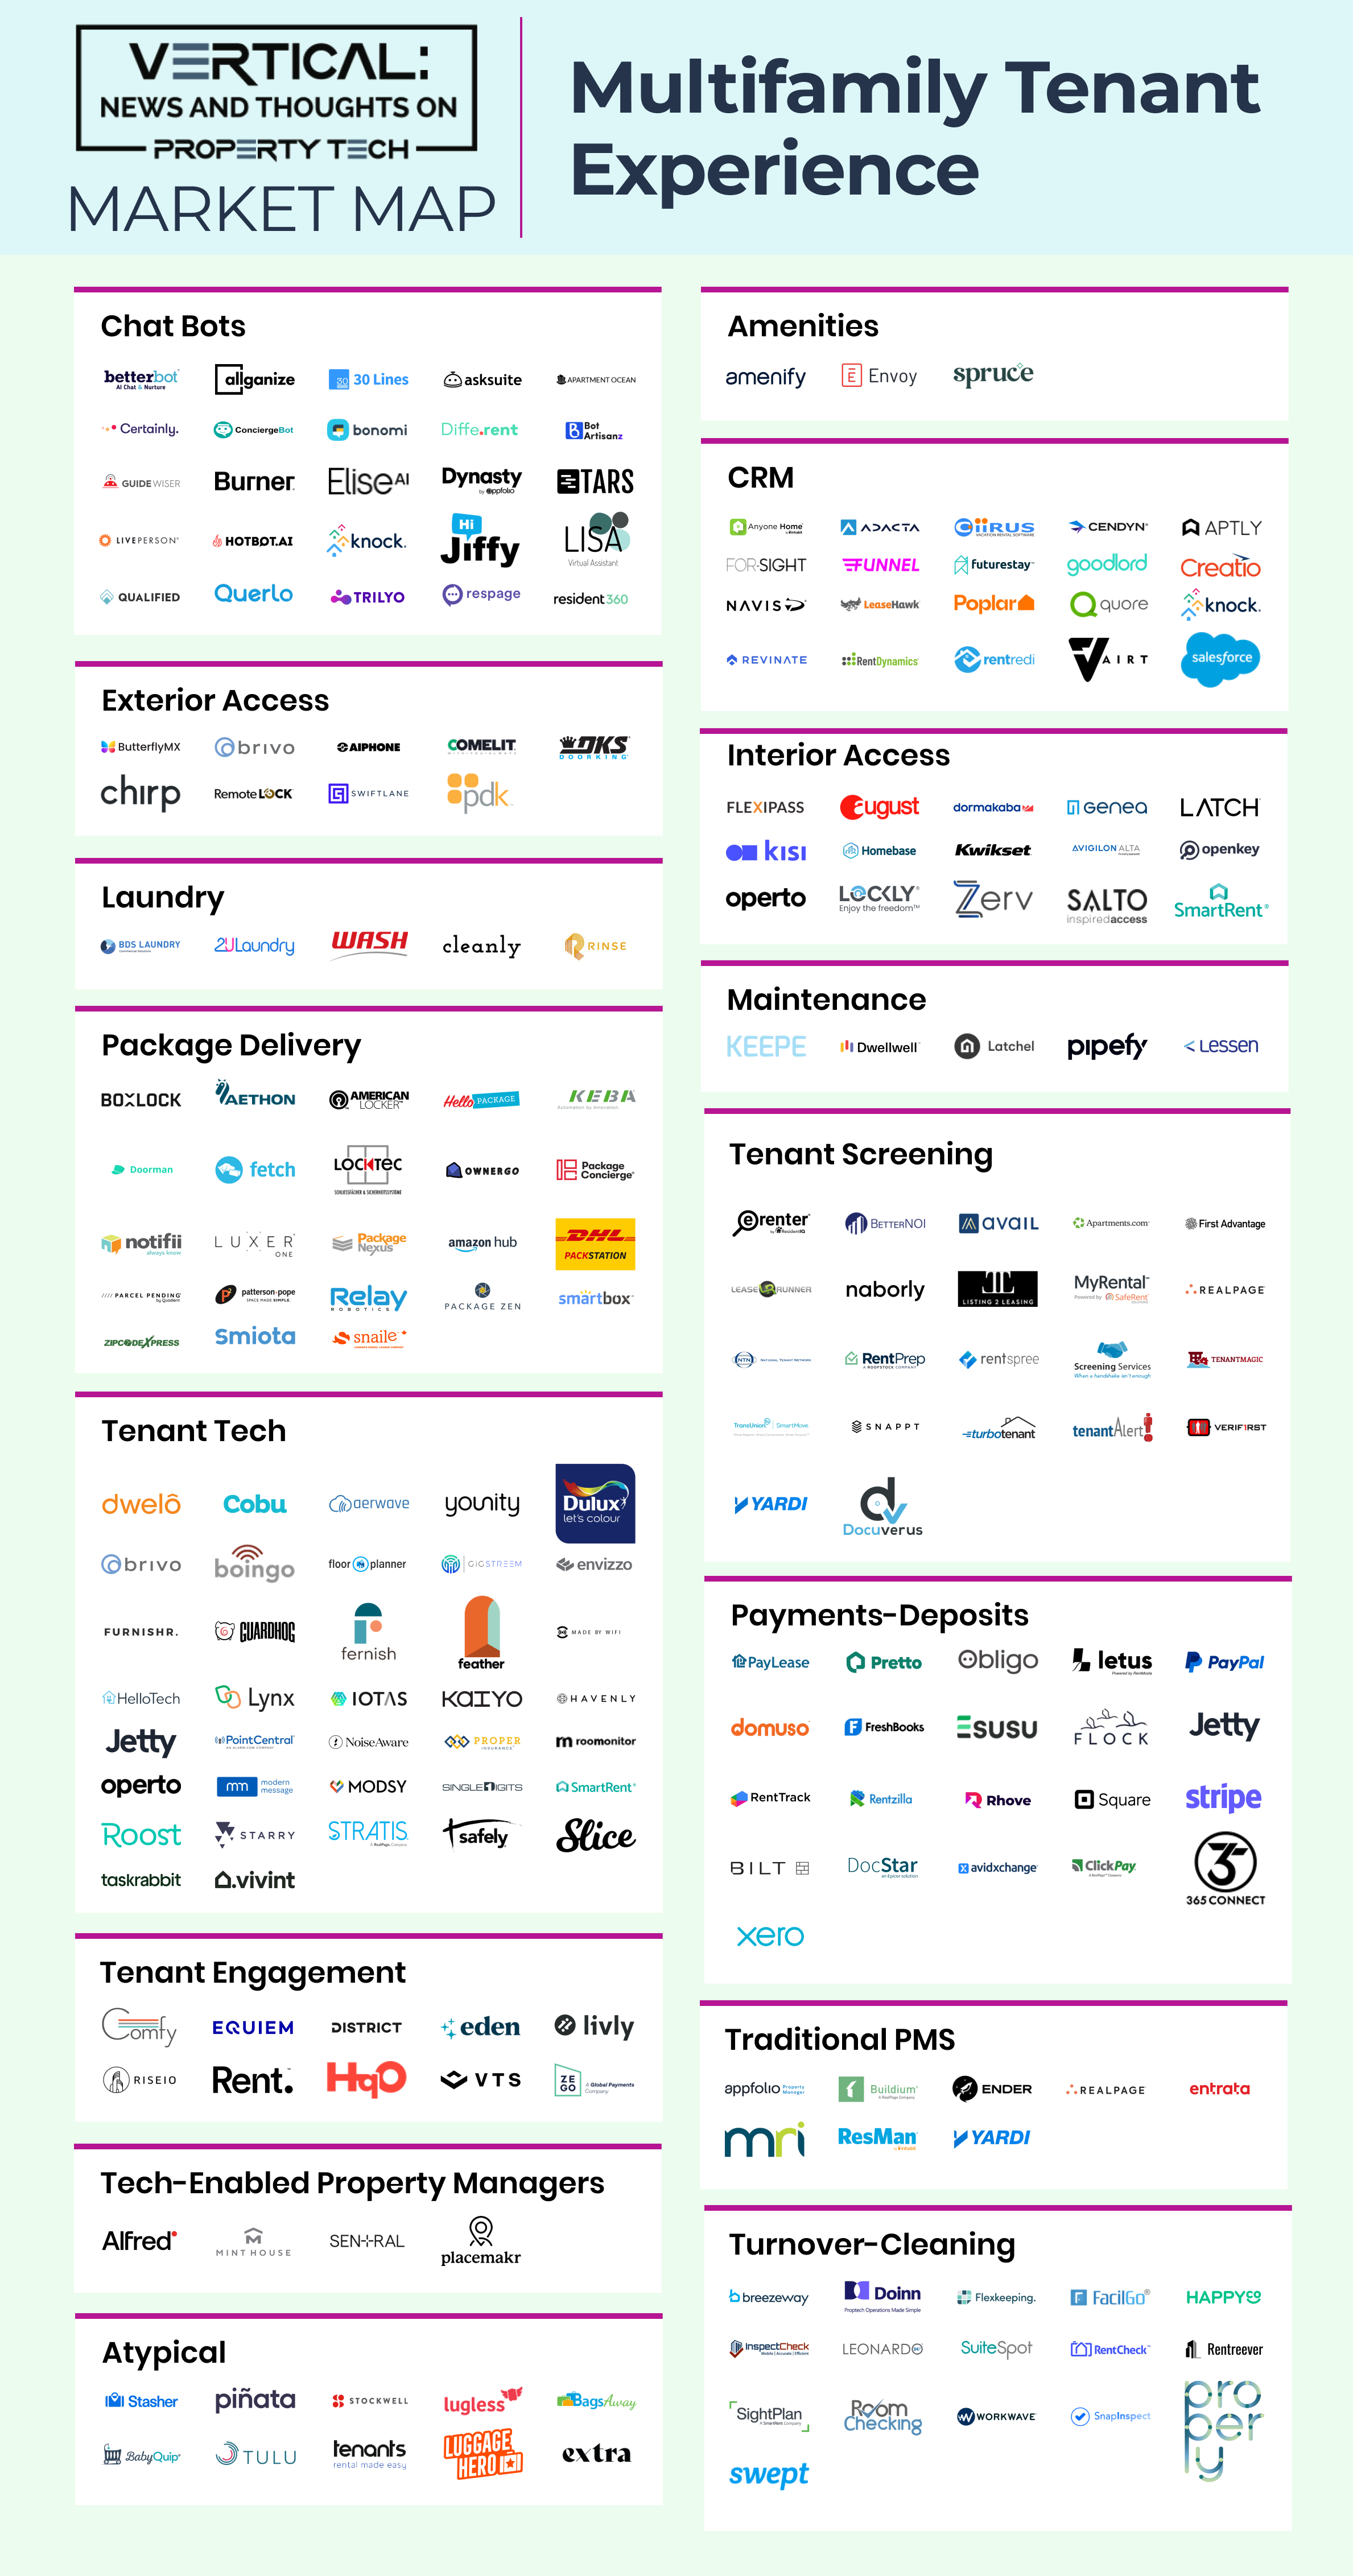
So, with that in mind, we created our first market map of exclusively multifamily technology companies. I broke down the categories into just the ones that touch the tenant directly (no accounting, back office, etc) and that left us with 226 unique companies. It looks like this:
Keep reading with a 7-day free trial
Subscribe to Vertical to keep reading this post and get 7 days of free access to the full post archives.


